NC Geological Survey


NCGS 200th Anniversary
The Geological Survey is celebrating its 200th anniversary with a series of events.
Learn More

What We Do
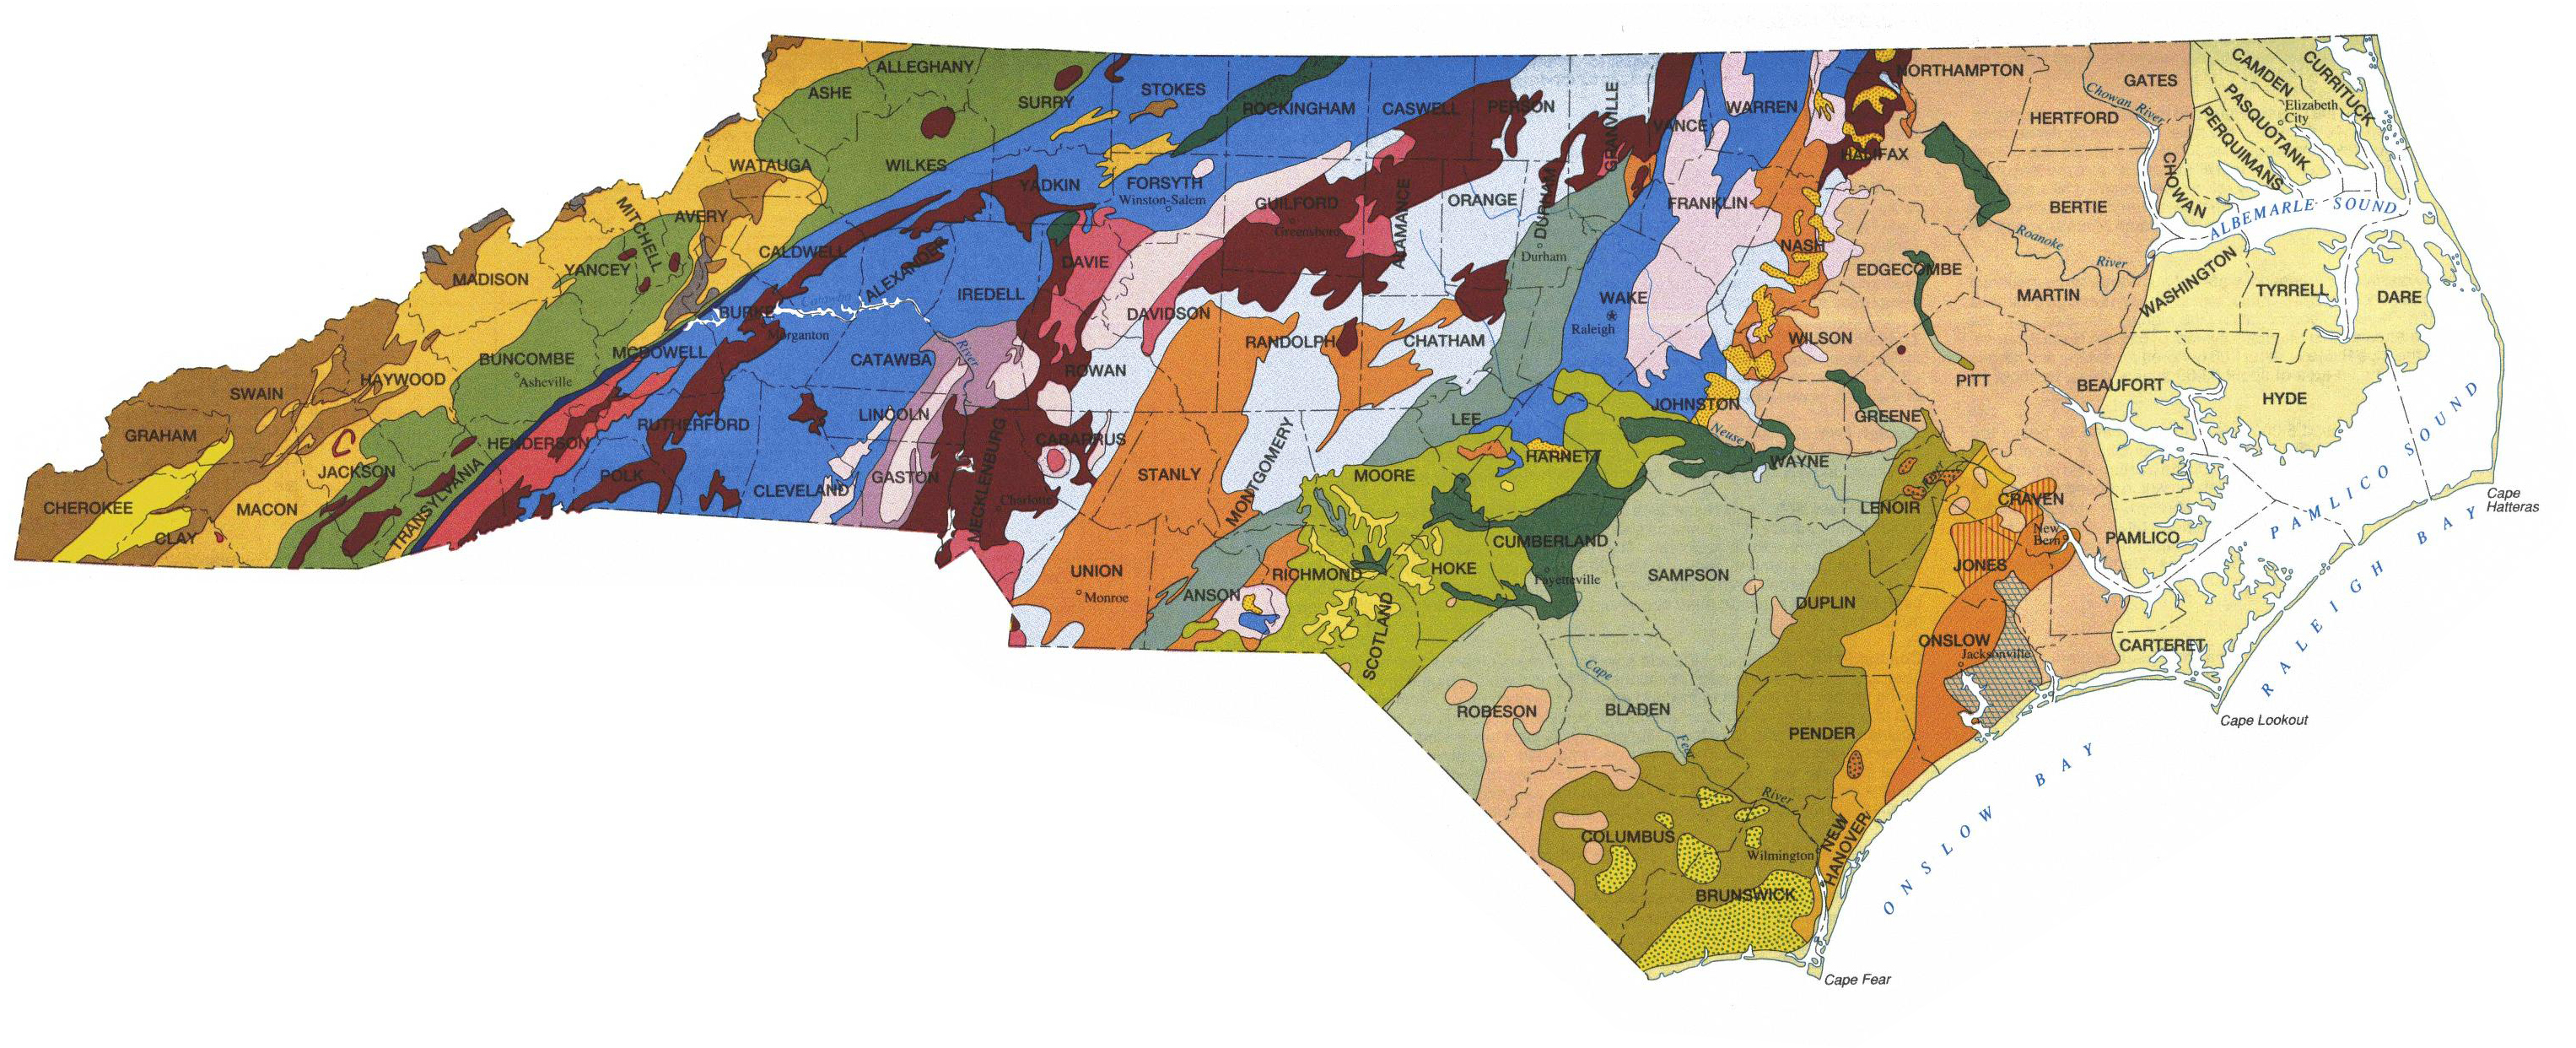
The mission of the North Carolina Geological Survey is to provide unbiased and technically accurate applied earth science information to address societal needs. This includes geologic maps, mineral resource and geochemical information, topographic maps and digital products, and earth science education initiatives. The agency examines, surveys and maps the geology, mineral resources and topography of the state, while encouraging the wise conservation and use of geologic resources by industry, commerce, agriculture and government for the general welfare of the citizens of North Carolina.


Maps and Publications
The NC Geological Survey online store offers North Carolina geological maps and publications for purchase.